Metabase is an open-source data visualization and business intelligence tool that helps you use data to answer questions about business processes and make educated decisions. Traditionally, BI tools can cost a fortune and businesses need to pay either for expensive enterprise software licensing, employ a cadre of data scientists and data engineers, or both. Today, the value of analytics continues to grow, but the introduction of open-source software such as Metabase has lowered the barrier to entry significantly.
This guide will explain how to install Metabase locally using Docker, probably the easiest and fastest way to install it.
1. Checking if we have docker on our local machine. If you see something like Client: Version: 19.03.8 which means you have docker running if not you can follow this guide.
docker version2. Now let’s pull a docker Metabase image.
docker pull metabase/metabase3. And run the image
docker run -d -p 3000:3000 --name metabase metabase/metabase4. If you use VirtualBox/Ubuntu (or other Linux) as your main working environment you will need to do port forwarding on port 3000.
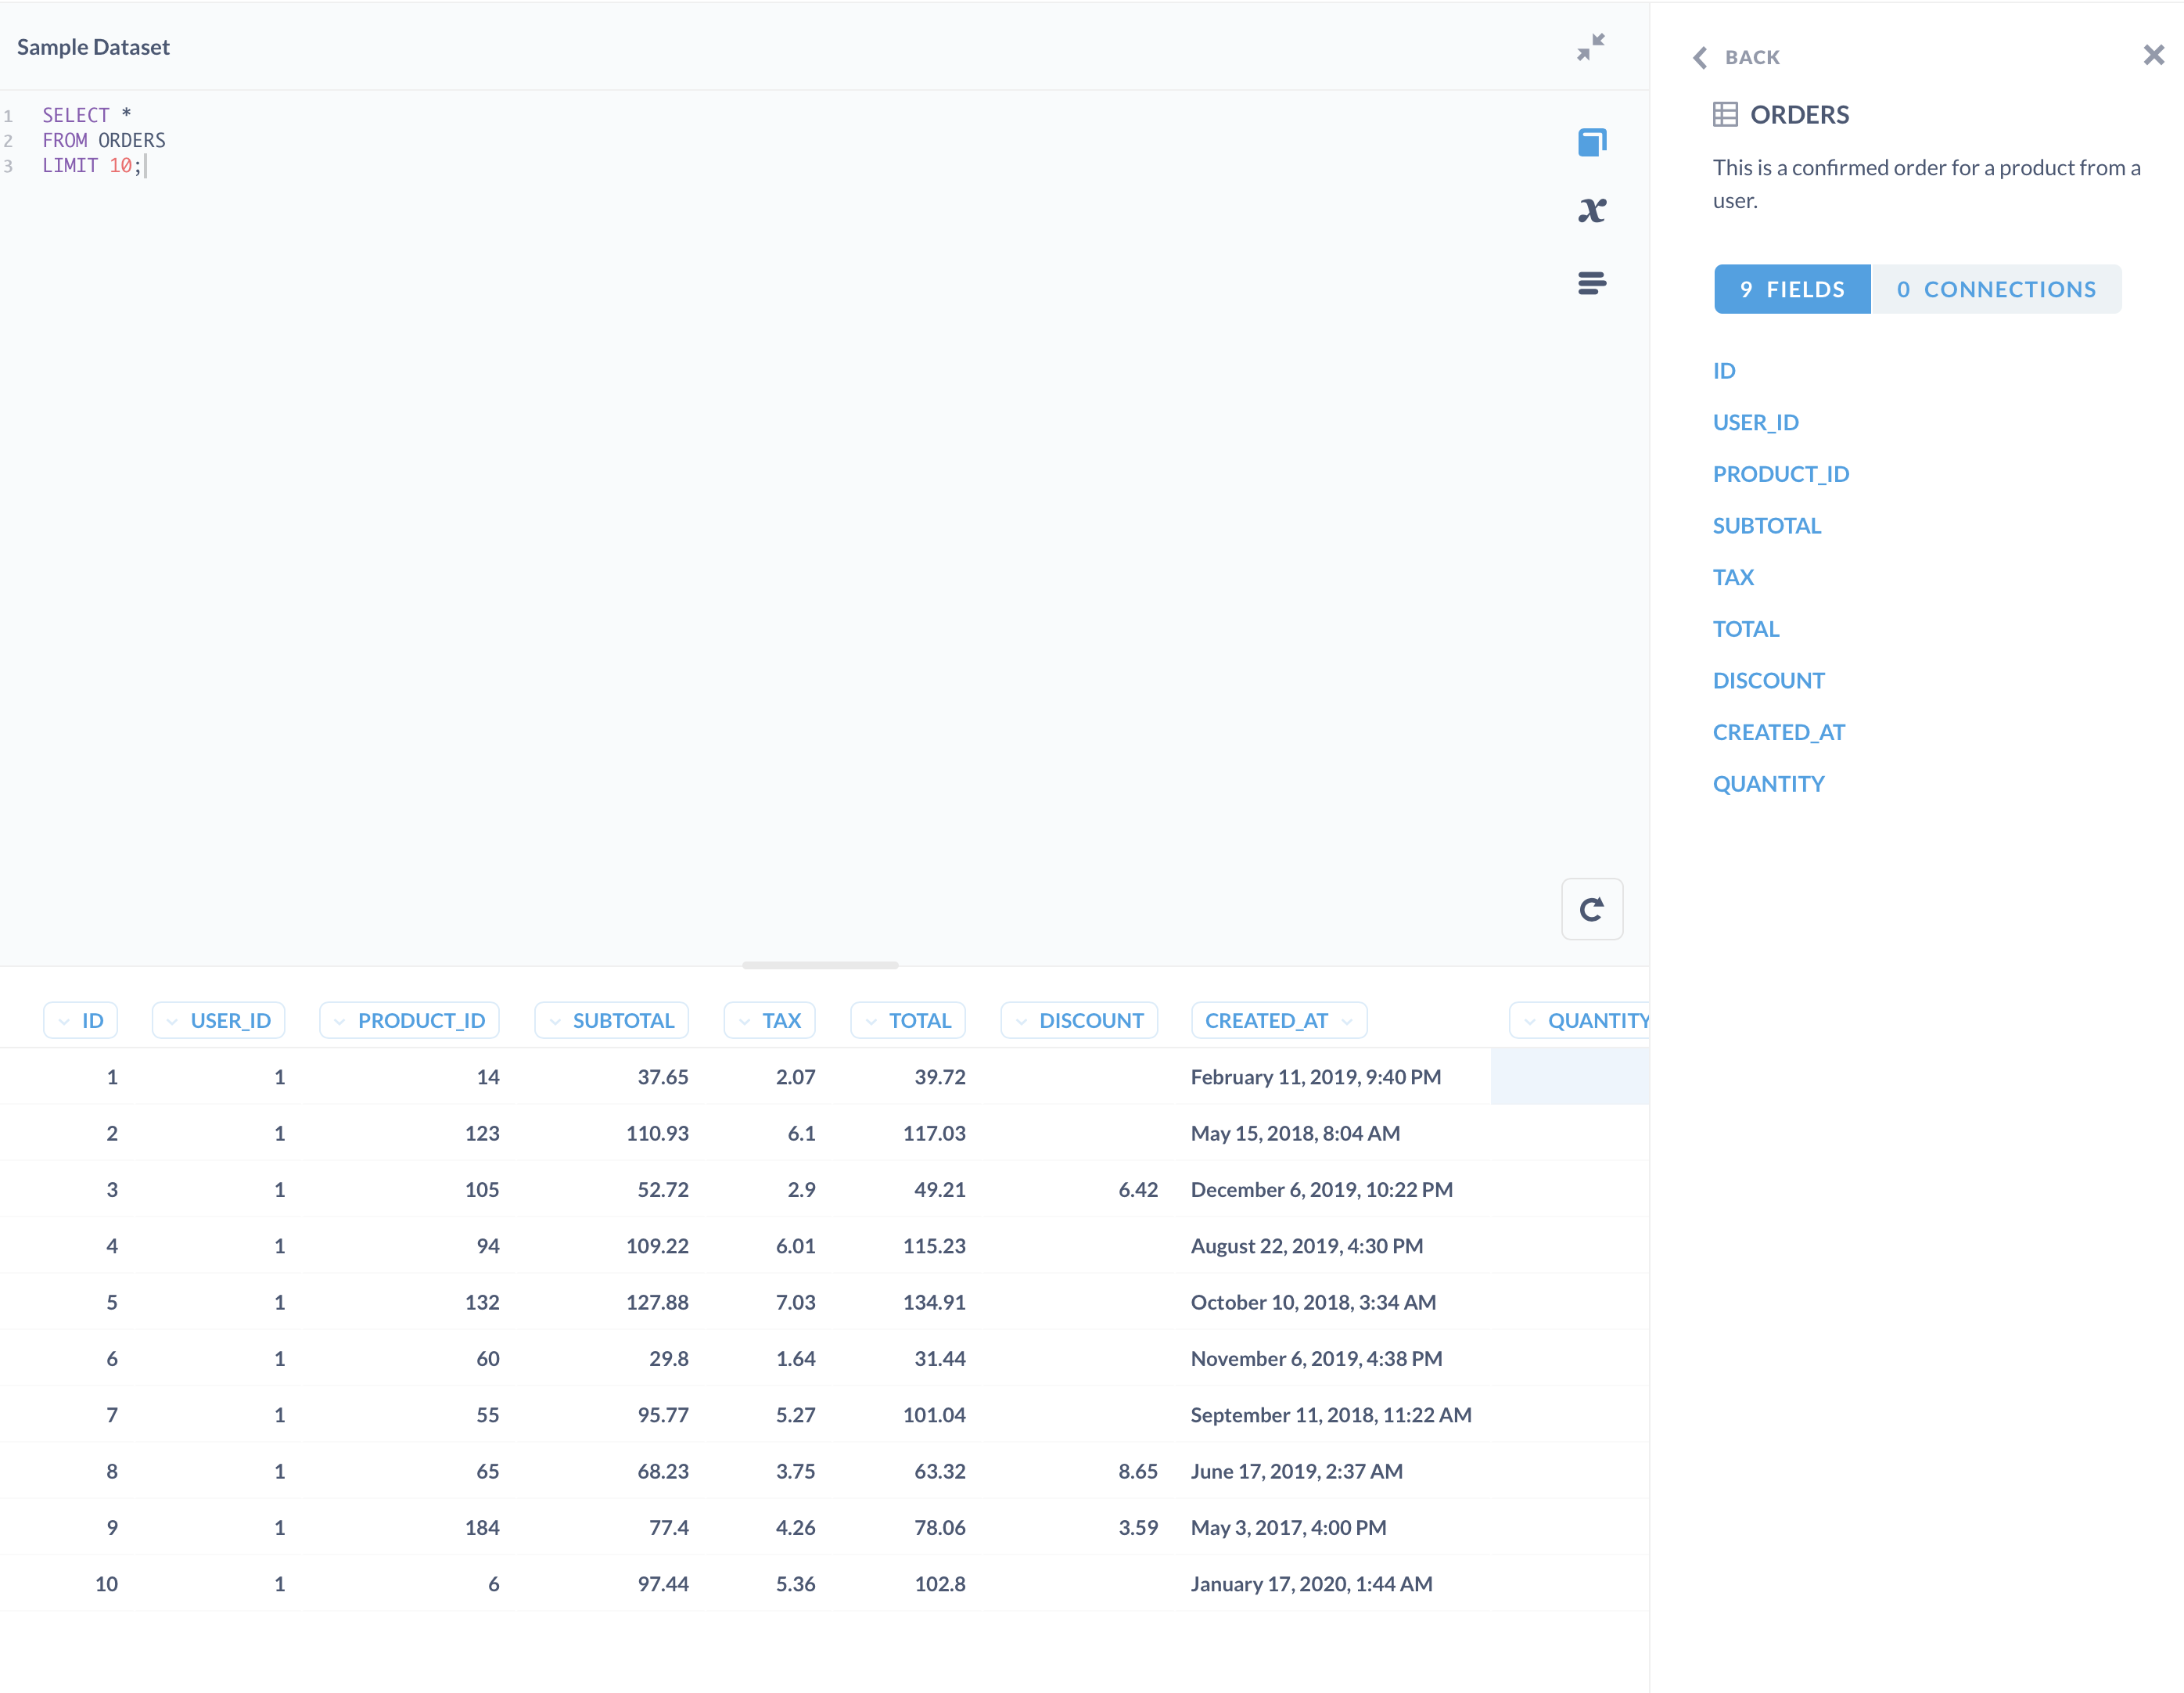
5. That is it! Now, we can access our Metabase in your browser by calling this page, localhost:3000. You will be asked to compute a few steps to create an account and initial setup. At this step you can skip connection to the database if you don’t have any DB available, Metabase provides a sample database so you can start using the tool right away. Metabase supports the vast majority of modern SQL and NoSQL databases. The is the compute list of currently supported databases.
- BigQuery
- Druid
- Google Analytics
- H2
- MongoDB
- MySQL/MariaDB
- PostgreSQL
- Presto
- Amazon Redshift
- Snowflake
- Spark SQL
- SQLite
- SQL Server
- Vertica
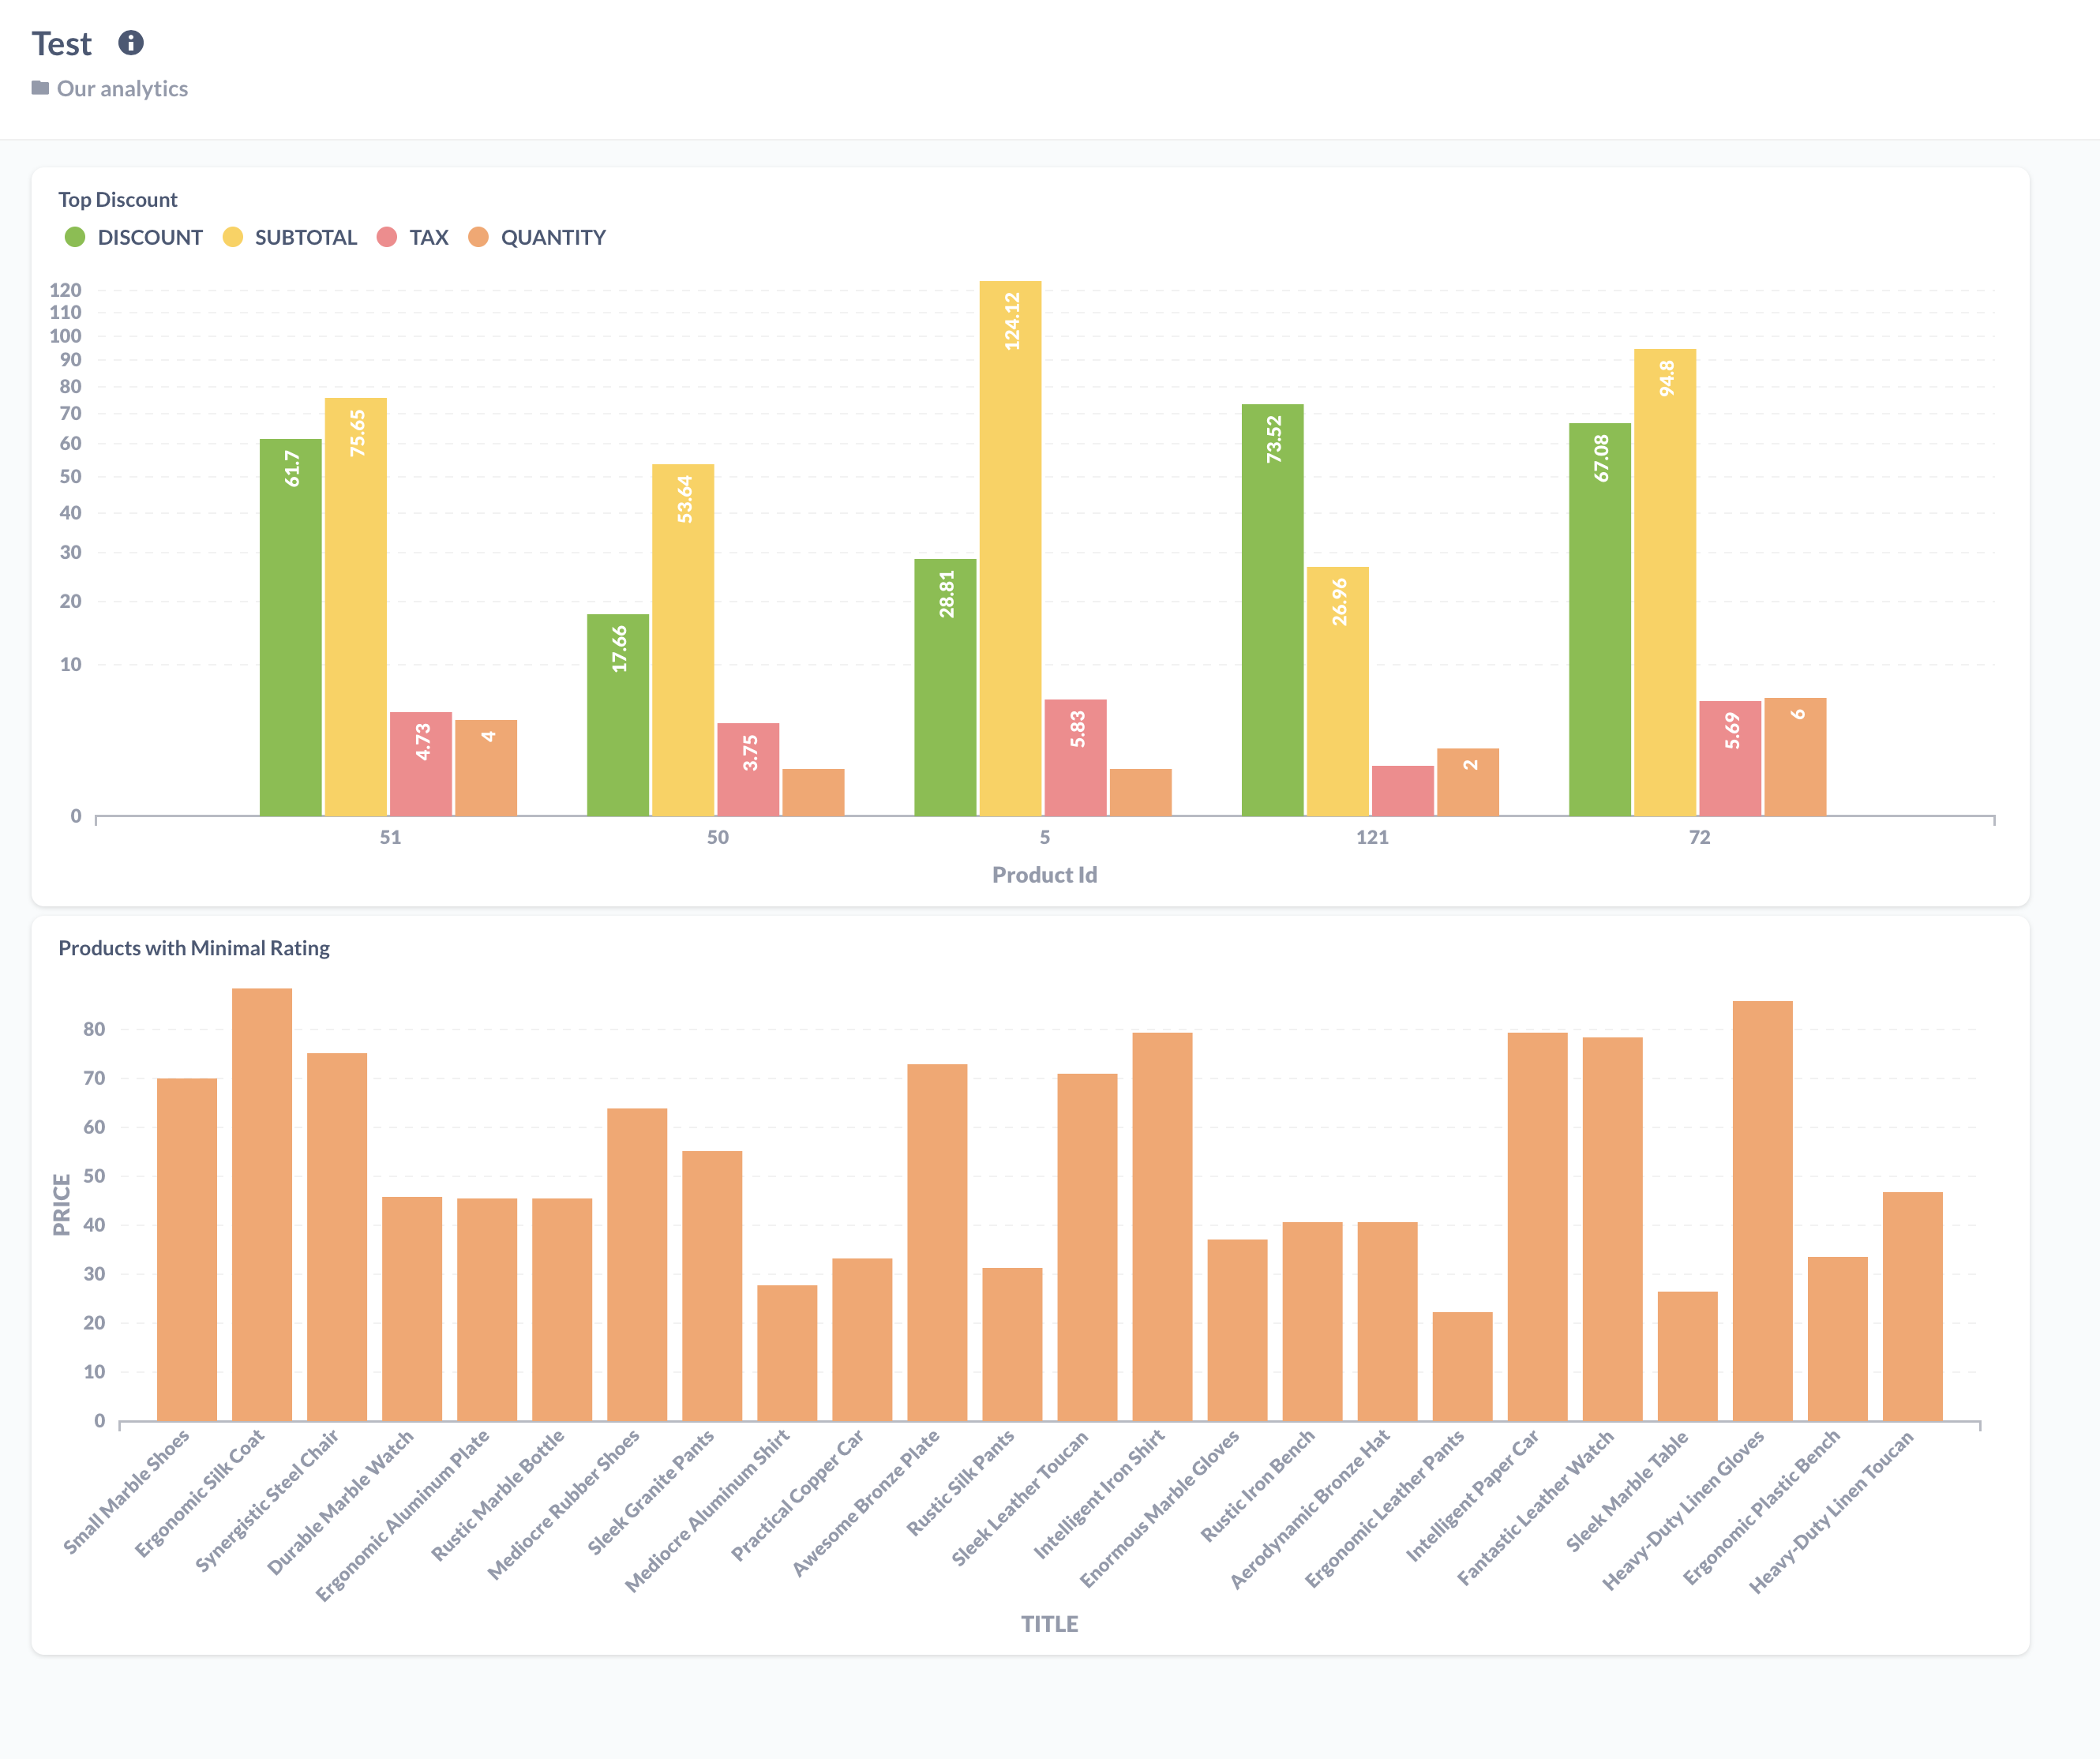
Metabase reminds me of Tableau but with a simpler and intuitive interface. It allows you to use SQL to slice and dice your data and visualize your query right away. There is a dashboard I was able to create after playing with the tool for not more than 30 minutes. I really like the intuitiveness of the tool and smooth transaction from SQL query to visualization that can empower users to extract valuable insights from the data.
And SQL interface looks very simple and clean, it allows you to access schemas of each table without running any queries like most of RDBMS.